Monte Carlo Results
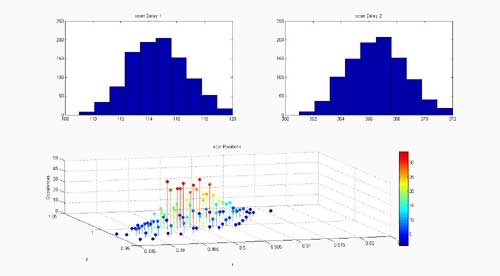
The Monte Carlo experiment was run several times. The first real trial was run for 1000 iterations. The system located the exact same point on all 1000 attempts. The precision was very high but was not what was expected. We realized that the noise level in the room was not enough so that the SNR had profound impact on the experiment. To get a better result, we turned back to the simulation again. In this case we are able to specify the noise level. With noise power set to 0.5. We again ran the simulated Monte Carlo for 100 iterations. The resulting data and calculations are then put into a previously unmentioned tool in the GUI application. This tool provides the histogram plots for the Monte Carlo data so we can better understand the variance. The tool performs two histograms, one for each delay measure, as well as one 2D histogram for the position measure. The results are shown below for the standard cross correlation result. The other two methods, PHAT, and SCOT, produce position values that are far outside the cluster of the majority. This causes the histogram for the delay to be very imprecise. The histogram and Monte Carlo experiment are very valuable in determining the effects of SNR which is something that is still being focused on.
